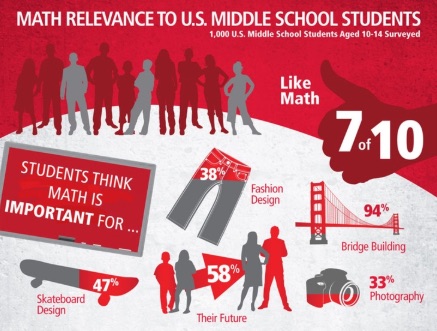
I consider myself an infographic enthusiast, and as a former middle school math teacher when the infographic below was passed on to me I was of course interested:

It was encouraging to see 7 out of 10 students liked math, but out of 1000 surveyed students, that means there are about 300 that don’t; and that isn’t so encouraging. Scrolling down to Top Favorite Subjects, I was again hopeful when seeing math ranked third.
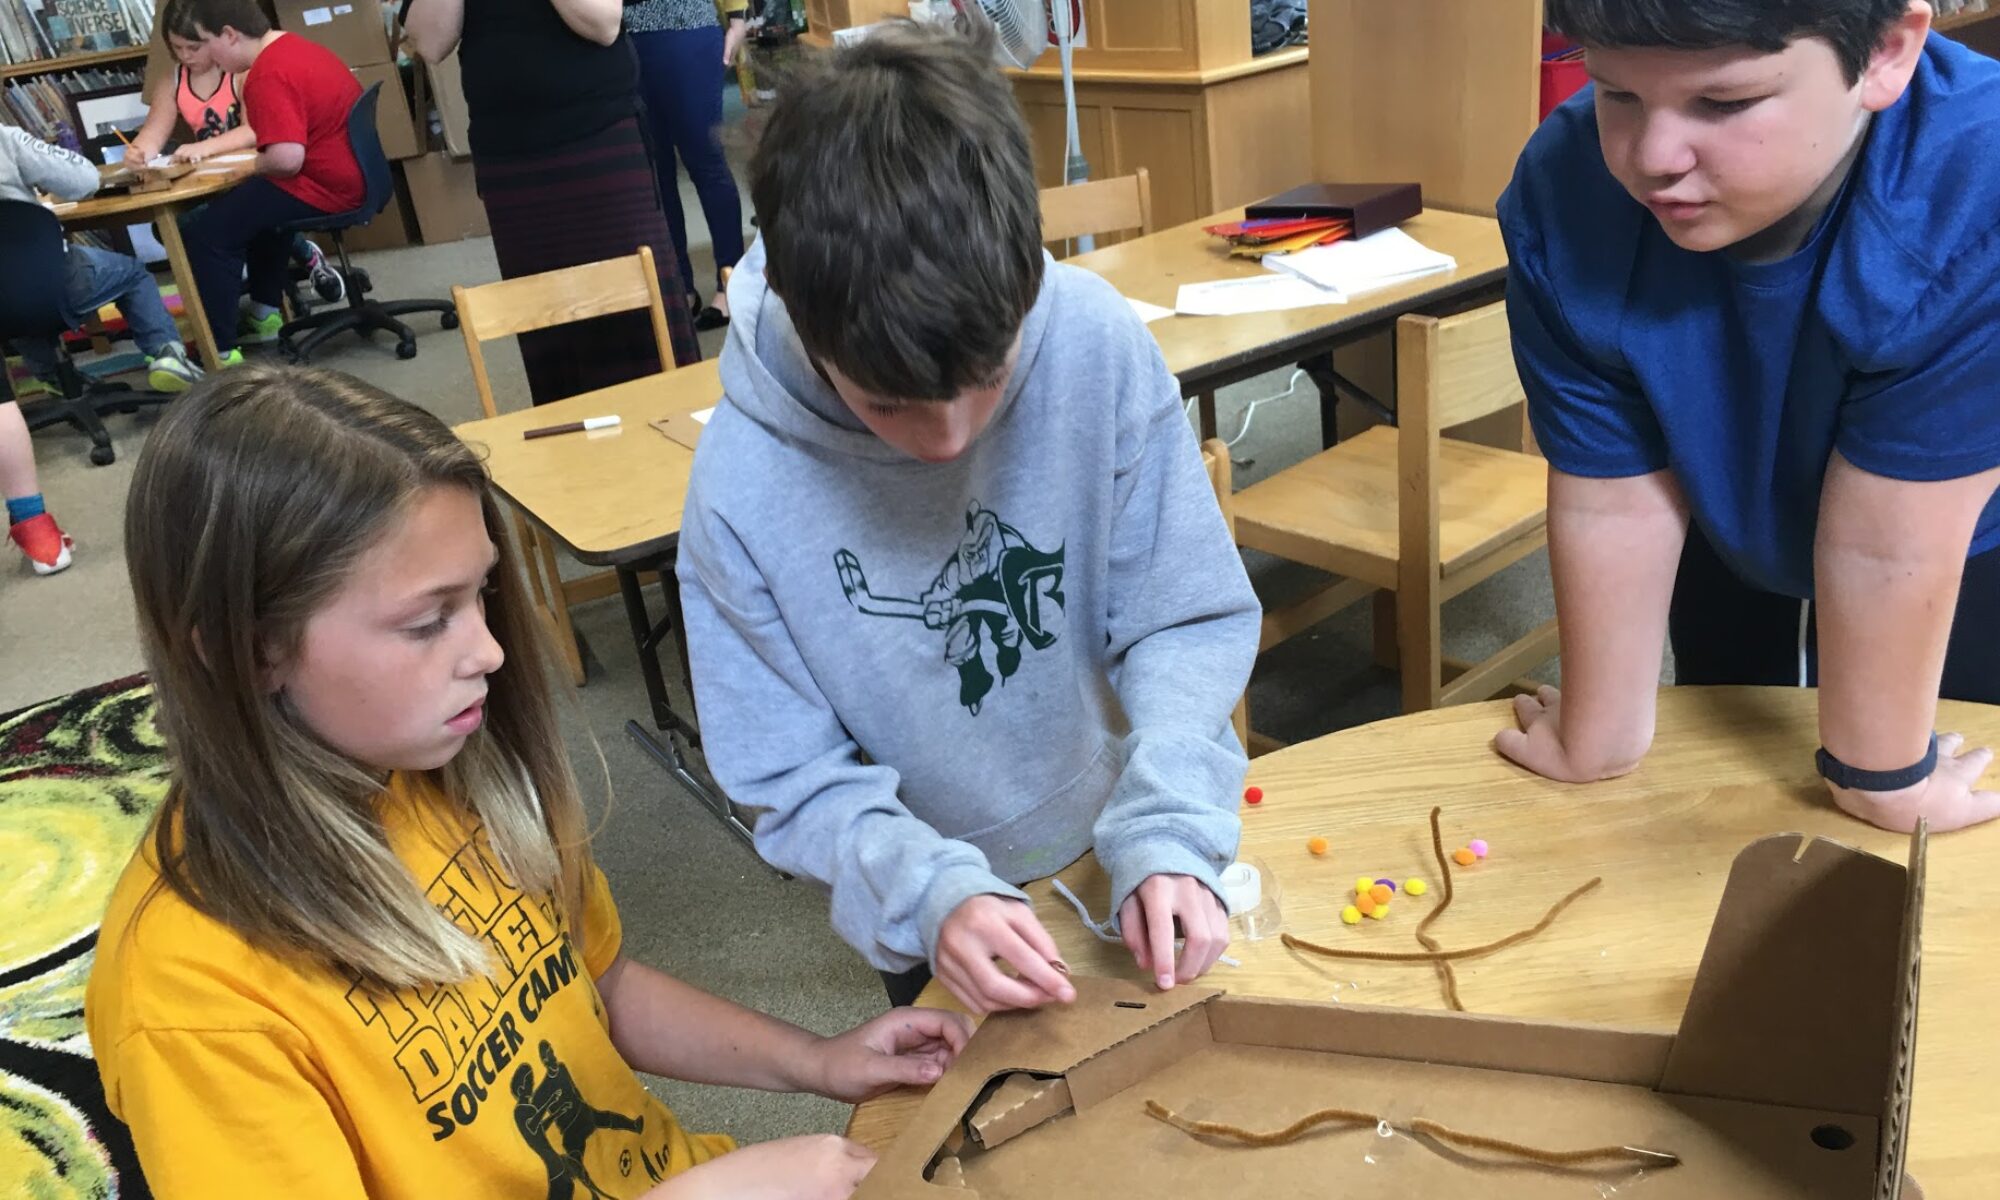
While that alone was pleasing to a former math teacher, I was also excited to see that P.E. and art ranked one and two respectively. I’m a firm believer that exercise boosts learning, and I don’t think I need to make a case for the connections between art, creativity, and math. I wasn’t surprised to see that students enjoy learning new subjects through hands-on activities, but what the Infographic leaves out is that only 4% of surveyed students enjoy learning new subjects through video lessons. During this revolution of flipped instruction, that 4% seems a little concerning.
So, what is my big takeaway from this Infographic? Relevance.
With only 58% of students reporting that math is important for their future, we don’t seem to be doing a good job of promoting authentic relevance to students’ lives. I don’t put much weight into the statistic that 38% of students think math is important for fashion design. What if I don’t care about fashion design? I’m certainly not going to care then about the necessary skills behind fashion design.
So how is math relevant to your students? And what can you do to support that connection?